
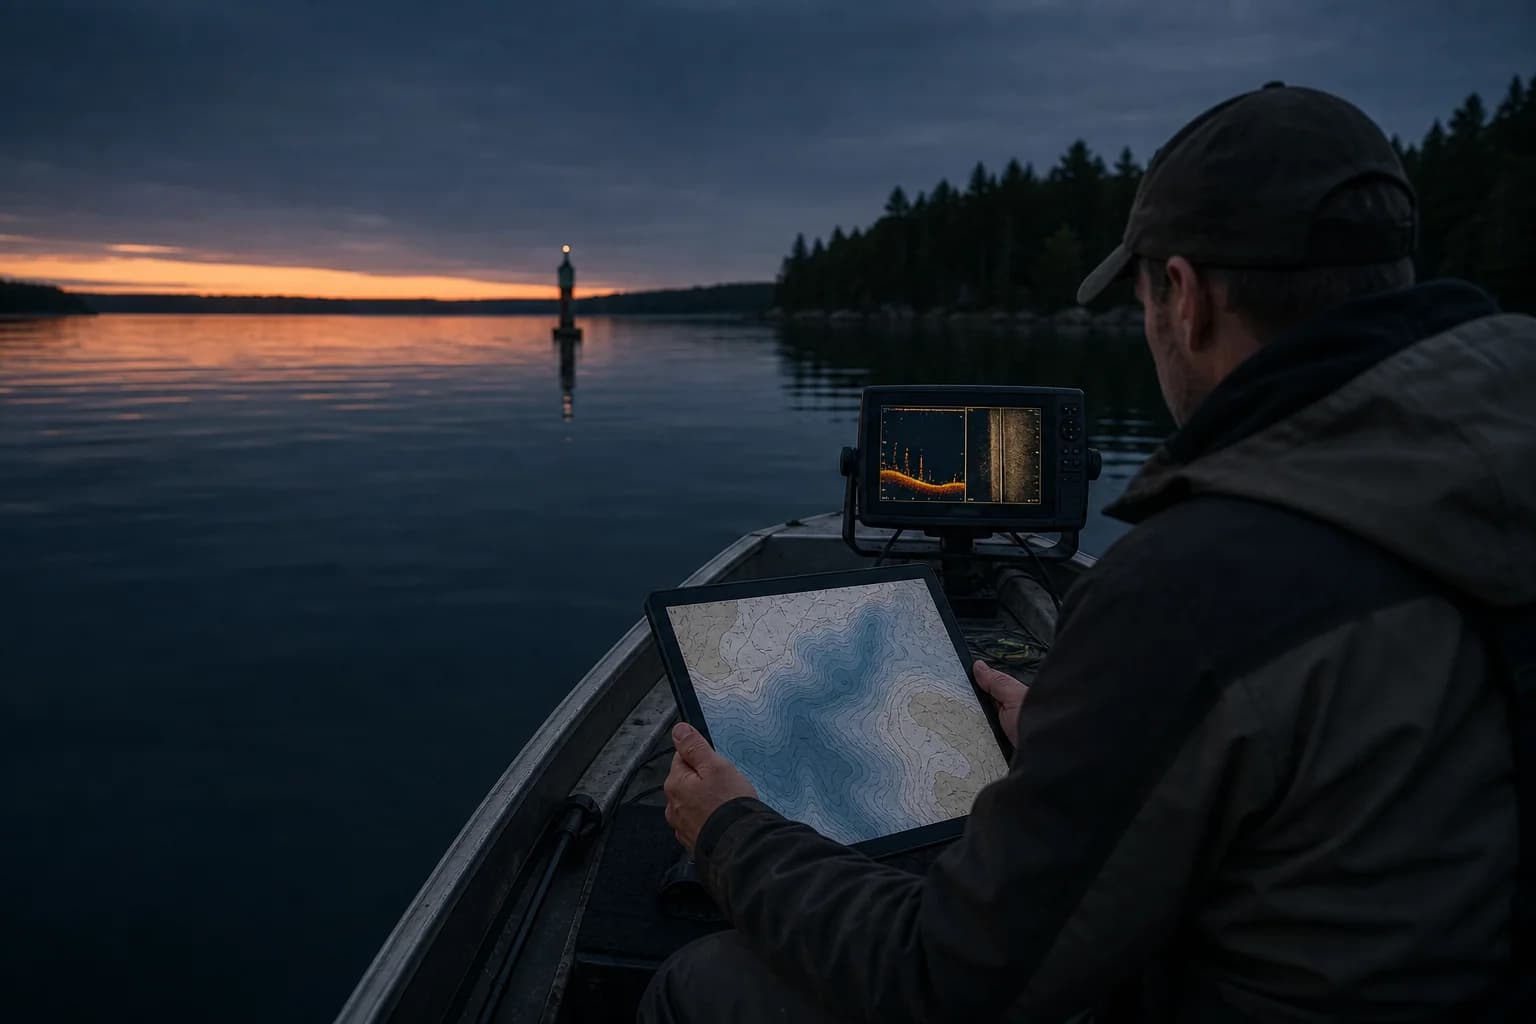
A lake depth map (more formally, a bathymetric map) and a nautical chart can both show water depth. That does not make them interchangeable.
The easiest distinction is purpose:
- A bathymetric map describes the shape of the bottom.
- A nautical chart supports navigation.
An angler may use both on the same trip. One helps identify a point, hump, basin, or channel worth fishing. The other helps plan a route around charted hazards, aids to navigation, restricted areas, and shallow water.
Live sonar does a third job: it measures what is beneath the boat now.
Map room
Plan. Navigate. Verify.
Three tools can show depth, but each earns trust for a different job.
Read bottom shape and choose structure.
Use official safety and route information.
Measure what is beneath the boat now.
Understanding those roles prevents a detailed-looking fishing map from receiving authority it was never built to carry.
| Question | Lake depth or bathymetric map | Nautical chart | Live sonar |
|---|---|---|---|
| Primary purpose | Describe bottom relief; support analysis or fishing plans | Support navigation | Measure beneath or around the boat now |
| Typical depth display | Contours, shaded depth bands, grids, relief | Selected soundings, depth areas, contours, safety information | Numeric depth and acoustic returns |
| Navigation aids and charted hazards | Usually absent or incomplete | Core content | Detects some nearby objects but does not replace a chart |
| Time represented | Date or era of source survey and processing | Latest chart edition using available source data | Current observation at the transducer |
| Area covered | Whole mapped water or project area | Official chart coverage | Boat track or sonar swath |
| Best fishing use | Find structure and plan areas to inspect | Plan safe travel where officially covered | Confirm depth, cover, bait, and fish response |
| Safe to use alone for navigation? | No | Use the current official product as directed | No |
The strongest fishing plan uses each tool for the question it can answer.
What a lake depth map shows
Bathymetry is underwater topography. A bathymetric map uses depths, contours, shading, or a grid to describe the relief of a lake bed, river bed, or seafloor.
NOAA's topographic and bathymetric map comparison defines the difference neatly: topographic maps show land elevation above sea level, while bathymetric maps show depth below a reference level. In both, a contour joins locations with the same elevation or depth.
For fishing, bathymetry helps answer questions such as:
- Where does this flat meet the basin?
- Which side of the point is steepest?
- Is that offshore high spot a hump or part of a ridge?
- Where does the creek channel approach shore?
- How many depth options can I fish without leaving the area?
A bathymetric map may contain extremely detailed survey data. It may also be an old agency lake map or a broad model. Detail alone does not establish whether it is current or suitable for navigation. Check the source, survey date, resolution, datum, and warning language.
What a nautical chart adds
A nautical chart is a specialized navigation product. Depth is only part of its job.
NOAA says a nautical chart provides hydrographic information along with features mariners need to travel safely, including obstructions, shoreline details, aids to navigation, anchorages, and other charted conditions. Its short explanation of the difference between a chart and a map emphasizes the chart's navigational purpose and authority.
Depending on the water and chart, you may see:
- selected depth soundings and depth contours;
- rocks, wrecks, shoals, and other charted dangers;
- buoys, beacons, lights, and daymarks;
- channels, fairways, and traffic information;
- bridges, overhead clearances, cables, and pipelines;
- shoreline and prominent land features;
- bottom characteristics;
- chart datum, scale, edition, and update information;
- notes, cautions, restricted areas, and regulations.
Symbols and colors on a chart are selected for navigation. A fishing map may draw every available contour to emphasize bottom shape. A nautical chart may select and generalize depths to communicate safe-water information at its intended scale.
Why the contour lines can look different
Two products can begin with related survey data and still show different lines.
A bathymetric product is often trying to represent bottom shape. A navigation chart is trying to communicate risk and route information clearly at a particular scale. Chartmakers decide which soundings, contours, labels, and hazards can be shown without clutter.
Scale is critical. A large-scale harbor chart shows a smaller area with more detail. A small-scale regional chart shows a larger area with less. Zooming a digital image does not create source detail that was not compiled for that scale.
Contour interval matters too. Lines every 2 feet can reveal features that disappear when contours are drawn every 10 feet. That does not automatically make the 2-foot map more accurate; the underlying survey must support the interval.
If you mainly want to interpret fishing structure, read How to read a lake depth map. If you need to move the boat, use the current navigation resources applicable to that water.
Charted depth is not real-time depth
The numbers on a nautical chart are soundings or depths referenced to chart datum. NOAA's guide to numbers on a nautical chart notes that the chart indicates whether depths are in feet, fathoms, or meters and that contours connect equal depths.
The water surface today can sit above or below the reference. Tides, reservoir operations, drought, flood, wind, and seasonal cycles change the water over the bottom. Charts and maps may also rely on surveys of different ages.
That is why a navigator combines the chart with current observations, notices, local knowledge, and conservative operation. For fishing, How water level affects a lake depth map explains how to adjust a target depth without pretending the correction removes every uncertainty.
Where a fish finder fits
A fish finder or sonar unit is not simply a more current map.
Traditional sonar shows acoustic returns beneath the transducer. Side imaging, forward-facing sonar, and multibeam systems look in different directions and widths. Some electronics record tracks that can later contribute to a personal contour map.
The strength of live sonar is immediacy. It can show the actual depth under the boat, vegetation, bottom hardness changes, bait, suspended targets, and features too small or too new for the map.
Its weakness is coverage. Until you pass over or scan an area, you have not observed it. A map provides context across the lake; sonar provides detail in the area you are currently checking.
Use the map to choose where to look. Use sonar and direct observation to decide what is actually there today.
What “fishing map” or “sonar chart” may mean
These terms are less standardized than “official nautical chart.”
A fishing map may combine bathymetric contours with species information, access points, marked structure, weather, or recommended areas. A commercial sonar chart may be a high-detail bathymetric layer compiled from proprietary, public, or user-contributed data. A government “lake map” may be a scanned fisheries survey sheet.
Read the product description rather than relying on the label. Ask:
- Who produced it?
- What source data were used?
- When were they collected or updated?
- Are contours measured, interpolated, or modeled?
- Does it claim navigation authority?
- What warnings and terms apply?
On DepthScout, Survey depth data and Approximated contours answer the measured-versus-modeled question directly. What “survey-backed” means covers the limits of that label.
Not every inland lake has a nautical chart
Official chart coverage focuses on navigationally significant coastal waters, the Great Lakes, and certain inland waterways. Many small and midsize fishing lakes have agency bathymetric maps but no official nautical chart.
That absence does not turn a fishing map into a navigation product.
On an uncharted inland lake, use available agency information, marked channels and hazards, local restrictions, current conditions, slow speed, proper safety equipment, and direct observation. Treat unfamiliar water as unfamiliar even when the contour layer looks precise.
For U.S. waters with NOAA coverage, the NOAA Chart Locator identifies available electronic navigational charts and related publications. Use current official products rather than old screenshots or cancelled paper editions.
Which tool should you open, and when?
At home: bathymetric or fishing map
Use it to understand the basin, compare structure, choose target areas, and build a short plan. DepthScout's Find a lake and lake catalog are designed for this stage.
Before departure: current official chart and notices, where applicable
Review routes, charted hazards, aids, restrictions, bridge or channel information, and relevant updates. Check current weather and water level separately.
On the water: chart, direct observation, and live instruments
Navigate with the correct current resources. Use sonar to confirm the fishing feature, not to excuse running blindly toward a waypoint.
After the trip: update the fishing plan
Record where the map matched, where level corrections were needed, which access worked, and what you observed. The next plan should begin with the lake you found, not the lake you imagined.
The simplest rule
If the question is “What shape is the bottom?”, reach for bathymetry.
If the question is “How should I navigate this covered water?”, reach for the current official nautical chart and associated navigation information.
If the question is “What is beneath me right now?”, look at live sonar and the water around you.
DepthScout is deliberately in the first category. It turns lake shape and source data into fishing guidance. It does not replace the second or third.